An Introduction to Geospatial Mapping: ArcGIS Online
ArcGIS Online (AGOL) is a cloud-based mapping and analysis solution. It can be used to make maps, analyze data, and share and collaborate. The data and maps created on AGOL are stored in a secure and private infrastructure and can be configured to meet your mapping and IT requirements. You can read more about AGOL here: https://doc.arcgis.com/en/arcgis-online/get-started/what-is-agol.htm
ArcGIS Online Account
Since ArcGIS Online is cloud-based (online), it does not require any installation and anyone can access it regardless of the Operating System they are using. It only requires you to have a Virginia Tech AGOL account and use one of the browsers supported by ArcGIS Online. These include: Google Chrome version 115 and later, Microsoft Edge version 115 and later, Mozilla Firefox version 117 and later, Mozilla Firefox version 115 (ESR), and Safari version 16 and later.
For best performance and full functionality, use the latest version of a browser listed above. Only WebGL-enabled, 64-bit browsers are supported.
- If you do not already have a Virginia Tech ArcGIS Online account, visit virginiatech.maps.arcgis.com, select the“Virginia Tech” login option.

- Then sign in with your Virginia Tech PID/pw/Duo 2FA as you are used to doing with other VT websites.
- Once this login is complete, your named user account in ArcGIS Online has now been generated for you automatically and can be seen on the top right corner.
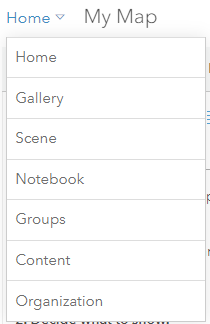
- Explore the different tabs on the page (including Home, Gallery, Map, Scene, Groups, Content and Organization) to familiarize yourself with ArcGIS Online.

Please note: This guide is designed with the assumption that you currently have an account on our Enterprise ArcGIS Online site. If this is not the case, kindly refer to the instructions provided above, under "Creating an ArcGIS Online Account," to create your account.
It is necessary to specify the organization that you are a member of when accessing the ArcGIS Online resources that are outside of Virginia Tech’s Enterprise URL of: virginiatech.maps.arcgis.com. You may be prompted for a username and password when signing on, so please note that using this prompt will fail.
Please visit the ArcGIS Online Account Maintenance webpage to learn about the cloud-hosted geospatial content management and services offered by Enterprise GIS.
Geospatial Data Curator

Creating your Project on ArcGIS Online
In this step, you will download the data files.
1. Open a new web browser tab or window.
2. Go to the following 4 links and download the data ZIP file.
i. Blacksburg Road Centerlines
ii. Corporate Limits
iii. Neighborhoods
iv. Places of Interest
3. Create a working folder on your local computer (you can give it any name) on the Desktop or Documents folder.
Note: throughout this exercise you will save all your data to this folder. When you create the folder, do not include any spaces or special characters in the folder name.
4. Confirm that the data files are stored in 4 folders. The names will correspond to the image below:

5. Leave this folder open.
Note: you downloaded the data files you will need to complete this assignment (these are vector data).
1. In the same virginiatech.maps.arcgis.com page that you created your ArcGIS Online account, click “Map” on the menu bar.

2. When you clicked on Map, you will have noticed the page opened up with a default reference map which is called a ‘basemap’ (this is a raster data). This basemap will be focused on the contiguous United States. You can leave this basemap as it is, but if you want to change it you will:

- Click on the Basemap, the Basemap pane appears
- Click on any thumbnail of the basemap that you want to use in the map (scroll down for more options)
What you see depends on the scale you are working on on your map - as you zoom in closer you will typically find more detailed information. Your scale is displayed below the map and automatically adjusts as you zoom in and out.
You can use the scroll button on your mouse to zoom in and out of the map, and you can left click and hold the click to pan around the map.
There are different sources where you can get geospatial data, you can read more about this in the “Sources of Geospatial Data” page. The data that you downloaded is secondary data since you did not collect it directly from the field.
a. Click the dropdown on the "Home" button on the top left and select "Content".
b. Click on the folder icon to Create a new folder, give your folder a name related to your project then click ‘Save’
c. Select “New Item”and navigate to your working folder where you downloaded the data by selecting “Your device”
and the zipped file of the first layer.
d. Under ‘How would you like to add this file?’ select “Add (filename) and create a hosted feature layer” and click “Next”.
e. The title of your file will be the file name (feel free to change it), under ‘Folder’ select “Create new folder” and add the folder name.
f. Add tags and summary to the layer if you want, then click “Save”. A layer will be added.
g. Select “Open in Map Viewer Classic”and the layer will be added on your map.
h. When prompted to change style, select the option that says ‘Single Symbol’ and click “Done”.
Do this for all layers separately until you have imported all 4 shapefiles (make sure all files are in the same folder):
-
BBRCL
-
Corporate_Limits+(1)
-
Neighborhoods
-
Places_of_Interest
- You should have all four layers on the map which can be seen in the Contents pane on the left.
- You can right click on any layer and select Zoom to Layer ro center it on the screen.

i. Zoom in and out of your map using the scroll button on your mouse, using two fingers on your touchpad, or right clicking and holding down.
j. Drag the layers up or down so that they do not cover each other (hover on the layers on the Contents pane and click on the 3 vertical dots on the left and drag to reorder layers.
- You will want the Places_of_Interest to be on top, followed by BBRCL, and then the Corporate_Limits, and finally the Neighborhoods layer will be at the bottom
- If your layers will not drag, click the 3 horizontal dots on the right
 , and select Move up or Move down.
k. You can turn layers on and off by checking/unchecking the box next to each name for easy visibility of other data layers.
Exploring the Attribute Table
- Every point, line, or polygon file has an attribute table.
- Click on the table icon
 under each layer to look at its data.
 - Any data in the attribute table can be used for displaying and labeling on the map and making queries.
- You can also create new columns in the table and add data or calculations.
- Metadata can be key to understanding attribute tables that use codes and abbreviations.
Data can be symbolized in a variety of ways, depending on the data format and available attributes. You can choose different symbols to represent the features you've added to the map. For example, water bodies and streams might be shown with a single, constant blue color, while roads might be symbolized based on road class. Additionally, you can use smart mapping styles such as dot density to find more meaning in the data.
Changing a Single Symbol
The ‘Corporate Limits’ layer is the boundary of the Town of Blacksburg and has only one field.
-
In the Layers/Contents pane, click the ‘Corporate Limits’ layer to select it.
-
On the Settings toolbar, click the icon for ‘Styles’
and go to “Options” under ‘Location (Single symbol)’
-
Select Symbols
 , since this is a border, we will want it to be transparent therefore, click the ‘No color’
box.
-
Select ‘Outline’ and select the color you will want to act as your border color.
-
Decrease the transparency to about 40% and increase the line width to about 5px (or any width that you feel works best).
-
You can also change the line pattern, then click ‘OK’ twice and ‘Done’

Symbolize Categories
-
In the Layers/Contents pane, click the ‘Places of Interest’ layer to select it.
-
On the Settings toolbar, click the icon for ‘Styles’
-
In the ‘Styles’ pane, under the ‘Choose an attribute to show’ dropdown menu, select “TYPE”.
-
Select the option that says ‘Types (Unique symbols)’.
-
The points in your map will be categorized based on the data that is in the ‘TYPE’ column of the attribute table (colors may differ from the image below).

-
Select “OPTIONS”. A new pane will open with the labels and their count number.
-
Click on the first dot icon of ‘Government’ to change the symbol.
-
Select “Shape” and in the dropdown menu select ‘Government’
-
From this menu, select any symbol that you would like to represent ‘Government’ on your map.
-
Change the symbol size in pixels using the scale bar under this pane and click “OK”

-
Do this for all symbol categories and select “OK”, then click “DONE”
-
Do the same for the roads (BBRCL) layer, categorizing them using any column from the attribute table. In this example, I will categorize the roads using ‘RD_MAINT’

-
Do the same for the ‘Neighborhoods’ layer.
-
This layer has 24 unique features, therefore after categorizing it as ‘Unique symbols’ you will notice that only 10 features will be categorized and the other 14 will be grayed out and fall under ‘Other’.
-
To fix this, click the “Ungroup” icon
and all 24 fields will be displayed uniquely.
-

Note: the colors on your map might be different, you may change them if you want.
-
If you want your Neighborhoods to have an outline, click on the Symbols icon
, select outline and choose the color, transparency, width and pattern of your outline and click ‘OK’ and ‘Done’.

Labeling your Map
Now we will add labels on the map so we can easily identify the neighborhood names.
-
Click on the ‘Neighborhoods’ layer so that it is selected, and click on the 3 horizontal dots
. -
Select ‘Create Labels’ and the Neighborhoods names will be added on the map.
-
You can change the different ways that your labels appear, are positions, placed, etc. in the pane that opens, then select “OK”.
Note: if you would rather have a different layer have labels, for example Places of Interest, then you can create labels for them using the same process.
-
If you had other layers on the Contents pane turned off, then turn them on as well and see how your map appears.

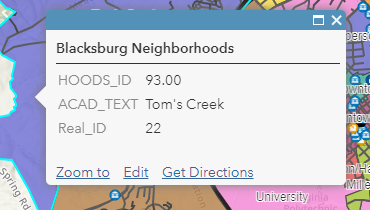
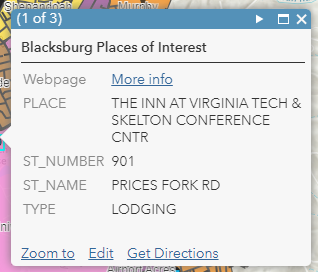
Pop-ups describe the attributes associated with each layer in the map and can include attachments, images, charts, and text, and they can link to external web pages. The default pop-up appearance for a feature layer is a list of attributes and values.
This is not a necessary step, but if you want to configure the pop-ups on your map to define the list of visible and hidden fields and how that information is presented you can follow the following steps:
-
Click on the ‘Neighborhoods’ layer so that it is selected, and click on the 3 horizontal dots
. -
Select ‘Configure pop-up’ and a new pane will appear.
-
If you want your pop-up to have a title, type it in the ‘Pop-up Title’ box.
-
Select the attributes that you want to appear on your pop-up and remove ones that you don’t need by clicking “Configure Attributes” and checking/unchecking ‘Display’
-
If you want the pop-ups to be disabled for any layer, in ‘Configure Pop-ups’ uncheck the “Show Pop-ups” box.
Hint: you can disable the ‘Corporate Limits’ and BBRCL pop-ups and configure pop-ups for the Neighborhoods and Places of Interest.
-
Save your map project.
Define the map legend
When you start a new map, or open a saved map of your own, it opens with the Contents pane showing. When anyone else opens your map, however, it opens with the Legend pane showing. You should think about how you want the legend to look. On the left toolbar, click the ‘Legend’ button.
Note: Legend entries are created for all layers except the basemap.
-
Click on the “Save” icon
on the menu bar and select “Save As”. A tab will open where you need to fill in information.

-
Type a title. A title is required to save the map.
-
Type the tags that describe the map.
-
Tags are words or short phrases that describe a map. Separate the terms with commas. Virginia Tech Blacksburg is considered one tag, while Virginia Tech, Blacksburg is considered two tags.
-
-
Type a summary that describes the map.
-
Choose a folder in “My Content” where you want to save the map.
-
If your organization (Virginia Tech) has set up content categories, use the drop-down menu to select one or more categories for the map.
-
6. Click on the “Save” icon
Sharing your ArcGIS Online Map
When creating or modifying a map that you own, sharing is possible, provided you have the necessary privileges for content sharing. Additionally, administrators within an organization can share a web map directly while it is being viewed in Map Viewer. Follow the following steps to share the map while you have it open:
-
Click on the ‘Share’ icon
from the Menu bar.
-
When you first create the map, it is automatically set to private. If you want to change this and share the map with others, check the box(es) on the pane.
-
If you are a member of any group within ESRI, you will also be prompted to share the map with these groups (not required).

-
You can also copy the link to the map which can be shared with anyone (checked in the boxes above) to view.
-
Once you finalize this, select ‘Done’