An Introduction to Geospatial Mapping: ArcGIS StoryMaps
ArcGIS StoryMaps
ArcGIS StoryMaps is a story authoring web-based application that allows you to share your maps by integrating narrative text, images, maps, and other multimedia content using this storytelling platform to visualize your story. It can be used to share information and engage decision makers. It is ESRI’s tool to craft a strong narrative and bring your content to life.
If you want to dive deeper, ESRI has assembled a variety of helpful tutorials, videos, articles, and more, so you can take your mapmaking skills to the next level. To get started with ArcGIS StoryMaps, follow this tutorial (with examples) for a beginner mapper.
When you are using ArcGIS StoryMaps, use the latest version of one of these browsers:
- Google Chrome
- Apple Safari
- Microsoft Edge
- Mozilla Firefox
You will need to sign in to ArcGIS StoryMaps using your ArcGIS Online account. If you don’t have an ArcGIS Online account, follow these steps to create one.
Geospatial Data Curator

Creating Your Story on ArcGIS StoryMaps
Before creating your story, it is a best practice to gather materials that you will use to tell the story. The text and graphics for this practice story have been provided by Esri and are available for you to download. In this step you will create the content inventory:
- Open a new web browser tab or window.
- Go to the ArcGIS StoryMaps Content folder and download all files from the folder and save them to your local computer.
- In File Explorer, open the StoryMaps folder to the contents that you will use.
-
Open the StoryMapsOutline.docx document and leave it open.
Note: the StoryMaps folder includes documents with the text that you will include in your story and a StoryMapsImages folder with image files for your story.
-
Open a new browser tab and go to https://storymaps.arcgis.com/.
-
Sign in to ArcGIS StoryMaps using your ArcGIS Online credentials and click Sign In.
-
Click “+ New story”
and select “Start from scratch” on the StoryMaps page to begin.
-
The story builder opens with a blank story template. You will have now created a blank story that you will begin populating.

You will add content to the blank story template. Using the outline document that you opened, you will start building the story using content blocks. Each title, paragraph, image, and media type is added to the story as a separate content block. In this step, you will be adding text to your story.
-
Review the StoryMapsOutline file. The outline organizes the text into blocks of content and categorizes the text as a title, a heading, paragraph text, etc. these categories align with the story elements in a later step.
-
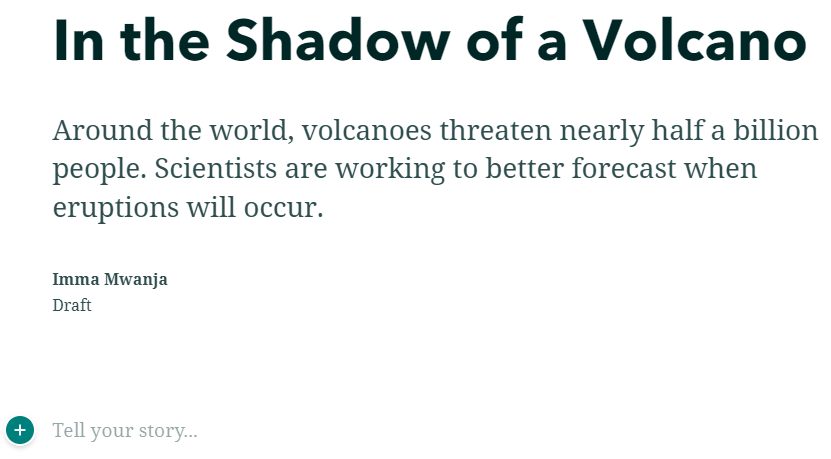
In the story builder, click “Story title” and type In the Shadow of a Volcano
-
Click “Start with a short introduction or subtitle (optional)" and type the following text: Around the world, volcanoes threaten nearly half a billion people. Scientists are working to better forecast when eruptions will occur.
-
If your byline was not automatically added, click “Add a byline (optional)” and type Volcano Expedition Team to specify the author of the story.
Note: when creating your own story, you can leave the byline with your name as the author.
-
At the top of the page, next to Draft, confirm that the story automatically saved.
ArcGIS StoryMaps automatically saves each edit to your story.
-
Under the byline, scroll down, if necessary, and then next to “Tell your story”, click the ‘Add content block’ button
.

The block palette appears with different elements that you can use to add content to your story:
- Text blocks like a paragraph, heading, or quote
- Visual accents like a separator or a button
- Media blocks like an image, video, map, or ember (for external web content)
- Immersive blocks like a slideshow, sidecar, or map tour (fullscreen blocks that provide a different interactive reading experience)
You will begin with a text block.
-
In your story, from the block palette, choose “Text”
-
Paste the first paragraph text from your StoryMapsOutline document: In 2017, a volcanologist, a photographer…
Note: these paragraphs serve as both an introduction to and a summary of your story. To emphasize this text, you will italicize it.
-
Highlight the first sentence, and then in the text editing toolbar, click the ‘Italic’ button
. Repeat this step for the following paragraph beginning with “Their goal…”

Note: the text is now italicized. You can also use keyboard shortcuts like Ctrl+I for italics and Ctrl+B for bold.
-
Under the second paragraph, click the ‘Add content block’ button
-
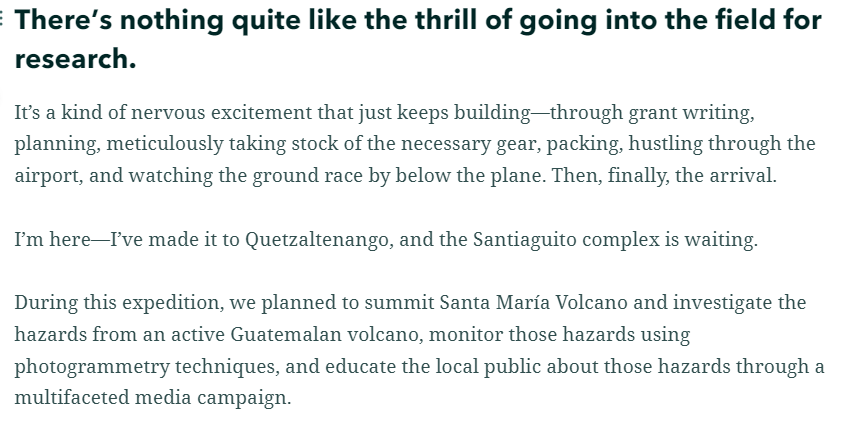
Paste the ‘Heading2” text from your StoryMapsOutline document: There’s nothing quite like…
-
Highlight the text, and then from the text editing toolbar, click the Paragraph down
arrow and choose Heading 2.

Note: this is your first heading. To add more content under the heading, press ‘Enter’ on your keyboard. Paragraph is the default element in the block palette, which means that you do not need to specify this element type before adding text to the story.
-
Paste the next paragraph from your StoryMapsOutline document: It’s a kind of nervous excitement… so they will be in the same block palette.
-
Use the StoryMapsOutline document to copy and paste the remaining text as paragraphs and headings.
Note: remember to add paragraph breaks to remove spaces from the text that you copy and paste.
After adding text, you can add media such as images and videos, to break up a long narrative and provide context to your story. In this step, you will add visual elements from your content inventory based on the outline. You will begin with the image of the volcano complex that the explorers visited.
-
Under the italicized introductory paragraphs, above the first heading, point to the left margin.
Note: if necessary, you can click the story title at the top of the page to automatically scroll to the top of the story.

-
Click the ‘Add content block’ button
that appears and choose “Image”.
-
In the “Add an image” window, click “Browse your files” and browse to the folder where you downloaded the story’s content in the “StoryMapsImages” folder.
-
Find and select ‘VolcanoPanorama’ image and click ‘Open’ then click ‘Add’
.
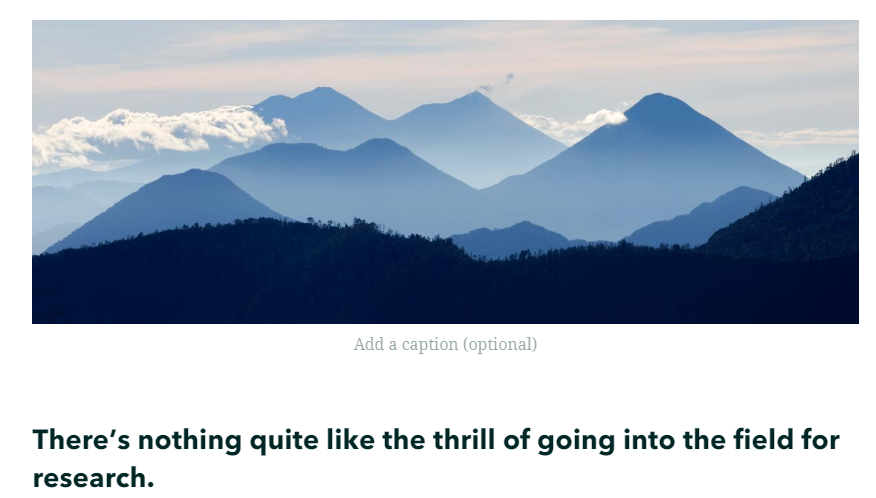
Because the image added to the story is a panorama, you will increase the size so that the image looks like a banner.
-
Point to the volcano panorama image, and on the image editing toolbar, click the ‘Large’ button
. The image will stretch across the story.
Note: the list of available image sizes on the toolbar depends on the width of the image that you upload.

-
Point to the volcano panorama image, and in the image editing toolbar, click the “Options” button
.
The “Image options” window appears. Here you can add attribution and alternative text to the image.
-
Attribution text allows you to give credit to the original content creator.
-
Alternative text, or alt text, describes the image so that anyone using a screen reader (often used by the visually impaired) will be able to hear a description of the displayed image.
-
Go to ‘Properties’ and under ‘Alternative Text’, type Santiaguito Volcano Complex, then click ‘Save’.
-
Beneath the text that you added as Heading 2, add an image.
-
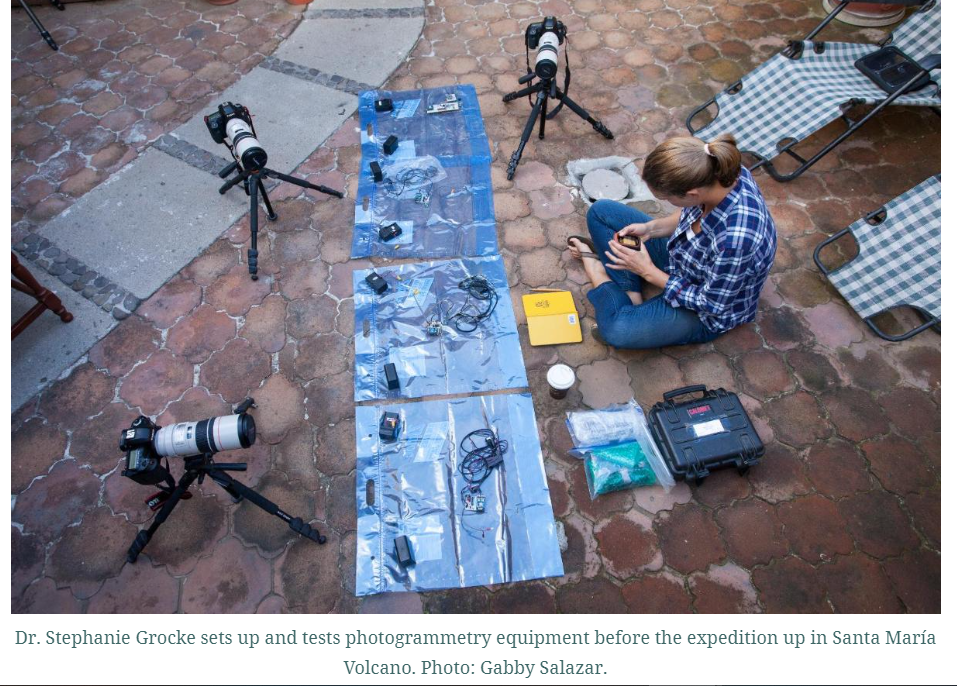
In the ‘Add an image’ window, browse to the images folder and then add the “Arrival” image.
-
Add the following alternative text: Scientist sitting next to three sets of photogrammetry equipment.
-
Under the image, click “Add a caption (optional) and type the following text: Dr. Stephanie Grocke sets up and tests photogrammetry equipment before the expedition up in Santa María Volcano. Photo: Gabby Salazar.
-
Notice how the media is being used to visualize your story and emphasize the text.
Adding media can be an iterative process where you modify text, graphics, and the order in which the content is presented.
In addition to text and media, adding an immersive block provides an interactive experience for your audience, different types of immersive blocks include slideshows, sidecars, and map tours.
In this step, you will add a sidecar, which allows you to add multiple slides. Each slide will have its own stationary media panel and a scrolling narrative panel with content such as text, media, and maps. This sidecar will showcase images captured by Gabby Salazar with an explanatory text.
-
At the end of your current story, click the ‘Add content block’ button
and, under “Immersive” choose ‘Sidecar’.
Note: if you chose to add all the optional text from the ‘Add text to your StoryMap’ step, add the sidecar after the paragraph that begins with: Each time I travel to Quetzaltenango…
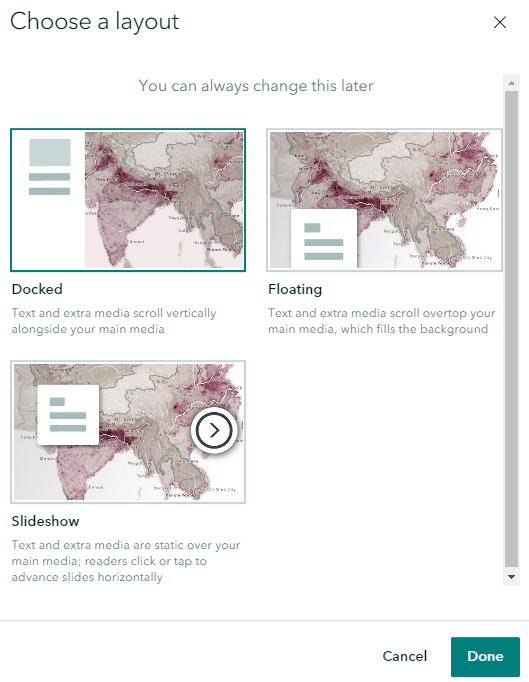
The “Choose a layout” window appears. The sidecar immersive block provides 3 different layout options.
Note: if you have not used a sidecar previously, you may see the “What is a Sidecar” wizard. Review each page of the wizard, using the ‘Next’ arrow to proceed to the following page. To close the wizard when you are finished, click “Got it”.
-
In the “Choose a layout” window, confirm that ‘Docked’ is selected, and then click ‘Done’.
A sidecar with one slide is added to the story. The media panel is on the right, and the narrative panel is on the left.
-
In the media panel, click “Add”
and choose “Image or video”.
-
In the “Add an image or video” window, add the ‘Coffee’ image.

The image of raw coffee beans is added to the media panel. Next, you will add an alternative text to the image and explanatory text to the narrative panel.
-
At the top of the image, click the Options button
. In this window, click the ‘Properties’ tab.
-
Add the following alternative text: Hands holding raw coffee beans. Then click ‘Save’.
-
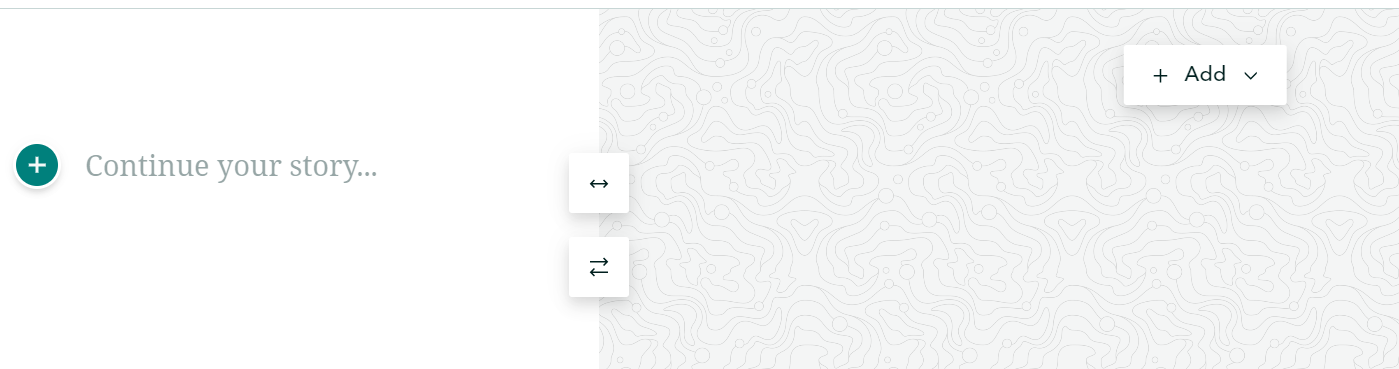
In the narrative panel, to the left of ‘Continue your story…’ add the following text as Heading 2: Agriculture around volcanoes thrives in the productive soil. Coffee grows particularly well around Santa María.
-
Press ‘Enter’ and type Photo: Gabby Salazar, leaving the photo credit in the default paragraph style.
The explanatory text is added to the narrative panel, completing the slide. The sidecar is complete, you can scroll up and down in the story to preview the reuters’ experience as they transition to the immersive sidecar experience.
One benefit of using ArcGIS StoryMaps is the ability to tie narratives to locations, another element that can be added to a story is an express map. An express map shows simple location information and allows you to use drawing and annotation tools to include information on a map. Express maps are made by the creator of the story during the authoring process, and they are stored as part of the story itself.
In this step, you will create an express map of Quetzaltenango, Guatemala, which is the location the story takes place.
-
At the beginning of the project, after the paragraph that begins with “In 2017, a volcanologist, a photographer, and a cartographer…” click the ‘Add content block’ button
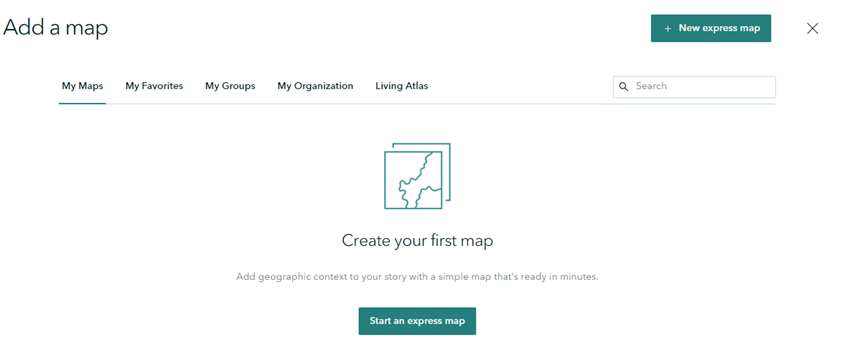
Note: the map browser appears. You have the option to create an express map or add an existing map or scene from your organization or ArcGIS Living Atlas of the World. Because this story takes place in Quetzaltenango, Guatemala, you will create an express map that helps readers identify this location.
-
Click “Start an express map”. If you have already created an express map, click “New express map”.
Note: if you have not used express maps previously, you may see the “Meet express maps” wizard. Review each page of the wizard, using the ‘Next’ arrow to proceed to the following page. To close the wizard when you are finished, click “Got it”.

The map designer displays a gray map of the world.
-
Above the map is a toolbar that you can use to draw features on the map.
-
To the left of the map is a side panel that you can use to review the layers in your map, bookmarks, and map settings.
You will use the toolbar to locate Quetzaltenango, Guatemala, which is the site of the expedition.
-
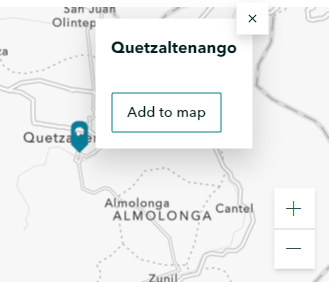
In the upper-right corner, in the ‘Search by location’ field, type Quetzaltenango, GTM and press ‘Enter’.
-
In the pop-up window, click “Add to map”. A pin will be added to the map.
-
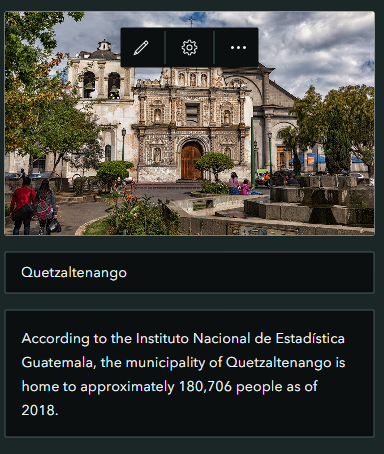
In the side panel, click “Add image” and select the ‘Quetzaltenango’ image and click ‘Add’.
Note: the Quetzaltenango image file is in the StoryMapsImages folder.
-
Under the image, in the “Description (optional)” field, type According to the Instituto Nacional de Estadística Guatemala, the municipality of Quetzaltenango is home to approximately 180,706 people as of 2018. Click “Done” in the side panel. This will list the newly named feature.

-
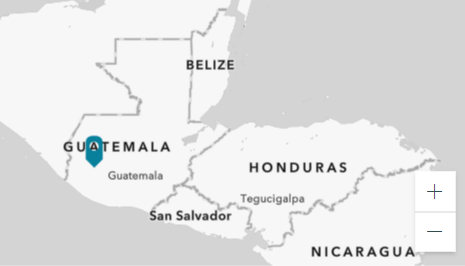
In the map, zoom out until you can see the entire country of Guatemala and some of its neighboring countries.
Note: you can use your mouse wheel or, in the bottom-right corner of the map, use the Zoom Out button
-
Pan the map so that the point is positioned near the center of the map view, as shown in the following image:
The map is ready to be placed in the story. After adding the map to the story, you can adjust the size of the map, interact with the map, and preview pop-ups.
-
In the bottom-right corner, under the map, click “Place map”. A map that shows the approximate location of the expedition will be added to the story.
-
Point to the map and in the image editing toolbar, click the ‘Small’ button
.
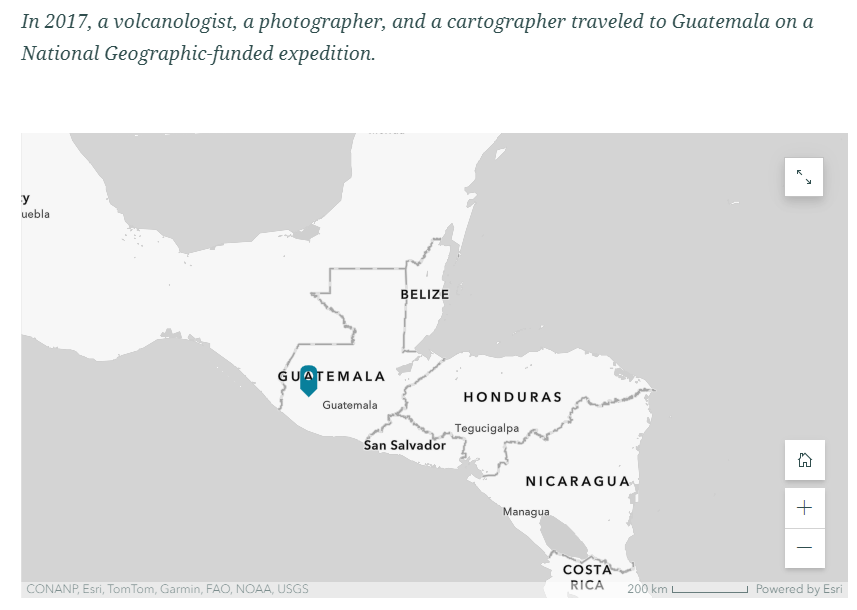
The map resized to match the width of the story text. You have added a simple example of an express map that uses a point feature and a pop-up to provide geographical context to your story. You can also draw lines and areas and use annotations to complement the features on your map.