

VTechWorks Session Information
About The Data
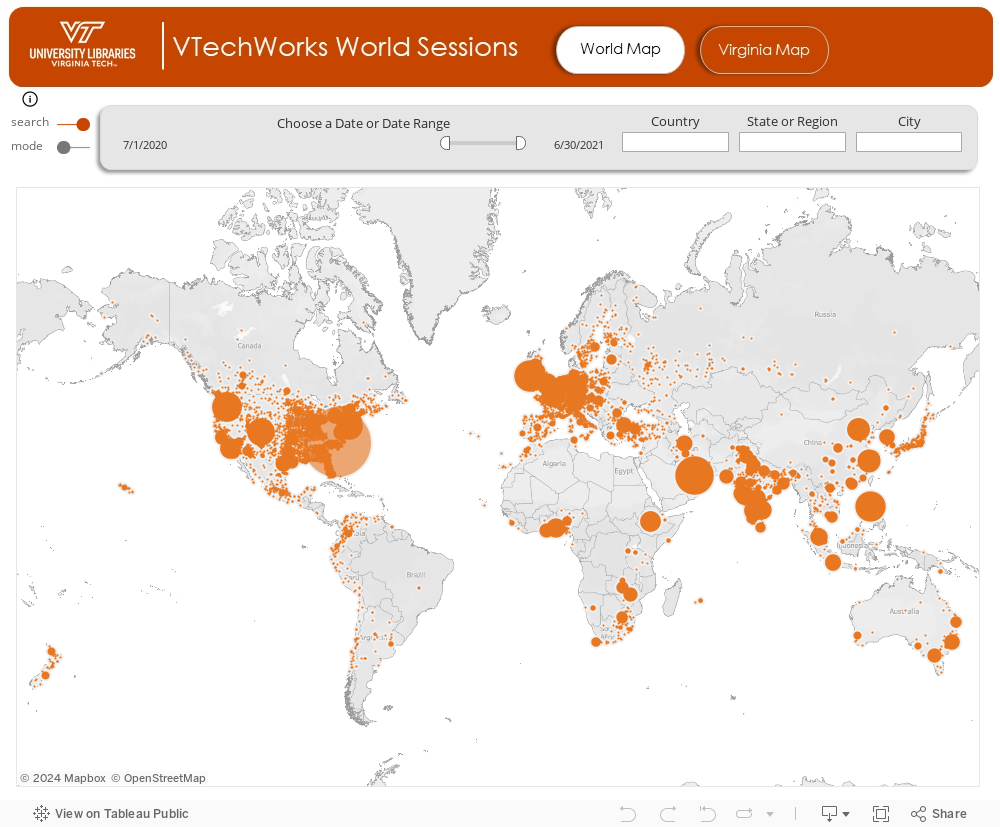
About the maps:
- There are three maps; one with a dark background, one with a light background and one that focuses on individual states within the United States (but defaults to the state of Virginia in particular). Choose the one that works best for you.
To use the map:
- Type in your region or regions of interest in the boxes above the map.
- Move the date slider to travel through time.
- Spot trends and patterns in geolocations to find valuable insights.
- At the bottom of the visualization, there are a set of arrows that indicate undo, redo, and reset.
- The date slider will carry through each tab, but the other search boxes are localized to each visualization.
About the data:
- Data comes from Google Analytics usage data.
- Because of the amount of data available, the map may take a little time to load.
What are Sessions, exactly?:
- Sessions are usually describes as the group of interactions that occur on a website during a given time span, usually 30 minutes.
- Sessions give an exact estimate of the number of times visitors opened the VTechWorks website and have carried out transactions/activities.
- When a visitor comes to the website, the visitor's session cookie activates and their session begins, but things such as the number of pages viewed by the visitor or what the visitor is doing exactly is not taken into consideration.